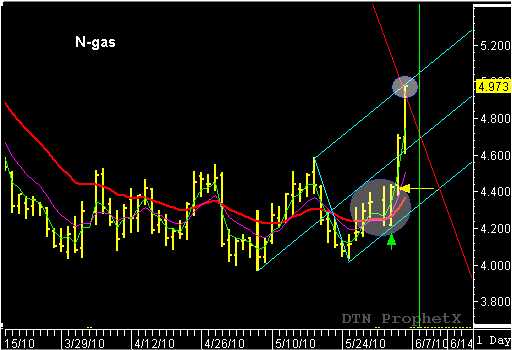
This is excerpt from the TMV Swing Trade report written on Thursday, June 3rd, after the buy recommendation was issued for the July Natural gas.
July Natural gas – Long from 4.4235 – last price @ 4.698 – July N-gas began to consolidate into a choppy sideways trading pattern in late March. The market stayed inside the 4.600 to 4.000 price range for over two months before finally breaking out and trading sharply higher on June 3rd. While a sideways consolidation pattern can offer trading opportunities for the astute swing trader, the risks are increased due to lack of momentum and lack of follow-thorough after a signal. However, all that changed during the last upward swing in the July N-gas. Between May 28th and June 1st, N-gas formed its first bullish reaction swing and a retest of the 20-day EMA. This was a change of behavior from the prior three upward swings that occurred during the two-month long consolidation. This was the first “market tell” that something had changed and it was time to pay attention to the N-gas. The reaction swing was bullish in nature, therefore suggested a possible bullish breakout with a buy trigger price at 4.435. Soon after I posted this signal in the newsletter, President Obama endorsed natural gas in a more positive way than he had ever done before and that was enough to trigger today’s significant rally. More importantly, the “market tell” signaled the market change early enough for a trader to take advantage of the rally that pushed N-gas to a new three-month high at 4.703. Hold the long position, with the stop loss at 4.435 and an initial target objective at 4.905.
Natural gas continued the strong rally into Friday and surpassed the target price objective projected at the intersection of the up-sloping reaction line (red line) and the up-sloping parallel line (blue line). This is a good example of how the “action-reaction” theory can be combined with the reversal date indicator to identfiy a “sweet spot” in the market that typically provides and entry before an exposive price move. The ability to identify the “sweet spot” pattern early and be can be a great advantage to swing traders. For more information on how you can learn to find this pattern yourself check out “Unlocking Wealth, Secret to Market Timing.

